

Understanding the 200-Day and 200-Week Moving Averages
What the 200-day and 200-week moving averages measure, how they differ, and why they are used as long-term trend gauges in market backdrops.
Last reviewed: November 2026.
Two long-term averages show up constantly in market commentary: the 200-day and the 200-week. They answer the same question, "where is the price relative to its long-run trend?", over very different time spans.
What each one is
- 200-day moving average: the average closing price over the last 200 trading days, roughly 40 weeks, or about nine to ten months. It is the most common dividing line between a long-term uptrend and downtrend.
- 200-week moving average: the average of one closing price per week — normally the last close of each week — over the last 200 weeks, close to four years. It moves slowly and reflects the market's multi-year trend.
Both are simple averages that update every period: the newest price enters and the oldest drops out. Because the 200-week covers so much history, price can sit far above or below it for long stretches. Note the construction difference: the 200-day average uses every trading day's close, while the 200-week average samples one close per week, so short spikes inside a week do not move it at all.
How they are commonly read
- Price above a rising 200-day: long-term uptrend intact.
- Price below a falling 200-day: long-term downtrend.
- Price breaks below its 200-day: a trend change may be starting, or it may be a brief dip.
- Price far above its 200-week: extended relative to its multi-year trend.
- Price near or below its 200-week: deep decline relative to its multi-year trend; historically uncommon for broad indexes.
"Extended" and "deep decline" are descriptions of distance, not predictions. An index can stay extended for a long time, and can fall well below its averages and keep falling.
Distance from the average
Many analysts focus less on the cross itself and more on the percentage gap between price and the average, for example "the index is 20% above its 200-week average." The gap gives a sense of how stretched the price is relative to its own history, and it can be compared across different periods. A large gap means the price has moved a long way relative to its trend; it does not say when, or whether, that will change.
False breaks and whipsaws
A single close across one of these lines is weaker evidence than it looks. Price can dip below the 200-day for a session or two and recover — a false break — or push above a falling average and fail within weeks. The averages move slowly, so the line barely changes while price chops around it, and each crossing in a flat, sideways stretch contradicts the last. These whipsaws cluster when the average itself is flat, because then even small price swings carry price across it repeatedly. Readers who use these levels usually ask for more than one close's worth of evidence: which way the average itself is sloping, how far price travelled to reach it, and whether price holds on the new side over the following sessions rather than snapping back.
Why they appear in a market backdrop
Because the same price signal can mean different things in different conditions, a backdrop that places an index against its own long-term averages adds context: is the market near its highs and far above trend, or already below its 200-day? Readings like the site's Fear Gauge serve the same purpose from a different angle — a compact summary of current conditions. Context tools frame the questions worth asking; they do not answer what happens next.
Limitations
- They lag. Both are built from past prices.
- They are widely watched, which can make a level feel more meaningful than the data supports.
- The 200 is a convention. Nothing special happens at exactly 200 periods.
- Individual stocks behave differently from indexes. A stock can fall below its 200-week average and stay there for years, so patterns observed in broad indexes do not automatically carry over.
Key points
- The 200-day is a roughly nine-to-ten-month trend line; the 200-week is a roughly four-year trend line.
- The percentage gap between price and average describes how stretched a price is.
- These are context tools, not predictors.
Related: Trend and Moving Averages · Golden Cross and Death Cross · Glossary
Educational material only — not investment advice.
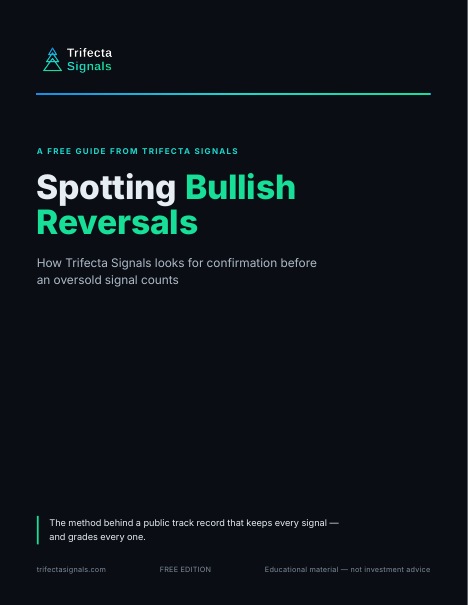
Spotting Bullish Reversals
The short guide to how Trifecta reads an oversold stock: the setup we look for, and why we wait for confirmation before an Early Signal counts. The same method behind the public track record.
Placing a price against its long-term trend is step one. The guide is step two — how Trifecta turns a washed-out market into a short list of oversold setups worth watching.
Your guide is on its way to your inbox right away, with the download link inside the email. Signing up also adds you to the Trifecta Weekly Market Review, our Friday newsletter. No card. Along with the guide, you’ll get a short series of follow-up emails from us over the next week, plus the Weekly Market Review. Unsubscribe anytime.
Your guide is on its way
We just sent your guide to — the download link is inside the email, and you’re on the list for Friday’s Weekly Market Review. If you don’t see it within a few minutes, check your spam folder.
Haven’t received it? Add [email protected] and [email protected] to your contacts or safe senders list — that helps your inbox accept both the guide emails and the Friday newsletter.
Didn’t get it? Resend the guide email
Wrong address? Use a different email
You’re signed in, so there’s no email step — the guide is yours to download. Your Weekly Market Review opt-in lives on your dashboard, where you can change it anytime.
Win 30 days of trial access
Take the 5-question Technical Analysis Quiz — get all five right and win 30 days of trial access to the Trifecta Signals stock screener. No card, nothing to cancel. Have an access code instead? Create a free account and add it there — trial access starts the same way.
Five questions, hints included. You sign in only when you claim your trial access.