

Free tools
Resources
Market context, free for everyone. The same charts and gauges our members start their day with — no account needed.
Start & Learn
New here? Start with the free guide, then test yourself.
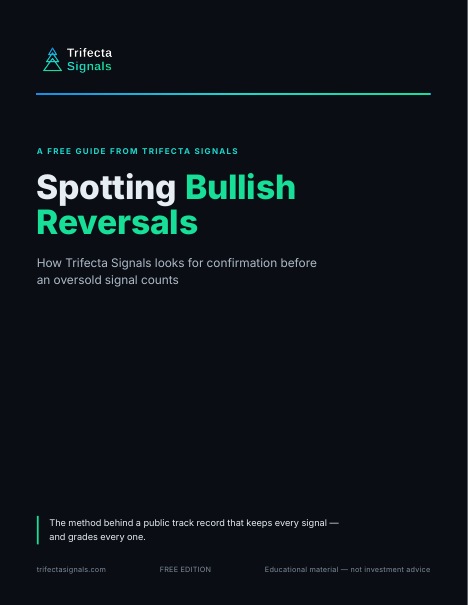
Spotting Bullish Reversals
The short guide to how Trifecta reads an oversold stock: the setup we look for, and why we wait for confirmation before an Early Signal counts. The same method behind the public track record.
The method behind every tool on this page, in one short read — the oversold setup we look for, why we wait for confirmation, and how every signal gets graded.
Your guide is on its way to your inbox right away, with the download link inside the email. Signing up also adds you to the Trifecta Weekly Market Review, our Friday newsletter. No card. Along with the guide, you’ll get a short series of follow-up emails from us over the next week, plus the Weekly Market Review. Unsubscribe anytime.
Your guide is on its way
We just sent your guide to — the download link is inside the email, and you’re on the list for Friday’s Weekly Market Review. If you don’t see it within a few minutes, check your spam folder.
Haven’t received it? Add [email protected] and [email protected] to your contacts or safe senders list — that helps your inbox accept both the guide emails and the Friday newsletter.
Didn’t get it? Resend the guide email
Wrong address? Use a different email
You’re signed in, so there’s no email step — the guide is yours to download. Your Weekly Market Review opt-in lives on your dashboard, where you can change it anytime.
Daily Market Context
Where the market stands today — the gauges our members start their day with.
Trifecta Fear Gauge
Where market fear stands today, and where it has been. One number, updated after every close.
Market Heat Maps
Whole indexes at a glance — every stock sized by market cap and colored by the day’s move.
Oil PricesNEW
WTI and Brent crude on one clean chart — the full daily history of both benchmarks back to 1986, plus the spread between them.
Money & Rates
The money supply, and the rates that price everything else.
M2 Money Supply
How much money is in the system — the government’s own series, charted so you can actually read it.
Federal Funds Rate
The Fed’s rate, its target range, and every move along the way — without fighting the FRED chart.
US Treasury YieldsNEW
Every maturity that matters — 1 month through 20 years — on one page, with today’s curve and the full history behind each yield.
US InflationNEW
Every inflation gauge that matters on one page — CPI, core CPI, the Fed’s PCE index and producer prices, back to 1913.
Company Events
The dates and deals that move individual stocks.
Earnings CalendarNEW
Every company’s earnings report dates in one calendar — this week day by day, then week by week and month by month, with before-open and after-close times and EPS estimates.
Mergers & AcquisitionsNEW
Takeovers, mergers and sale processes touching stocks we track — why an announced deal puts a caution on a signal, and why a closed deal freezes a stock’s record. Every entry is sourced to its SEC filing.