Free chart · Interest rates
Treasury Yields
US Treasury yields for every major maturity — 1-month bills to the 20-year bond — on one interactive chart, with daily yields and monthly history back to 1962. These are the rates the whole financial world is priced from: mortgages, car loans, corporate debt and the stock market's discount rate all key off this curve.
Treasury yield by maturity
Percent per year · daily yields for the last two years, monthly averages before that · pick a maturity, then scrub the chart
Move or drag along the chart to see the yield on any date.
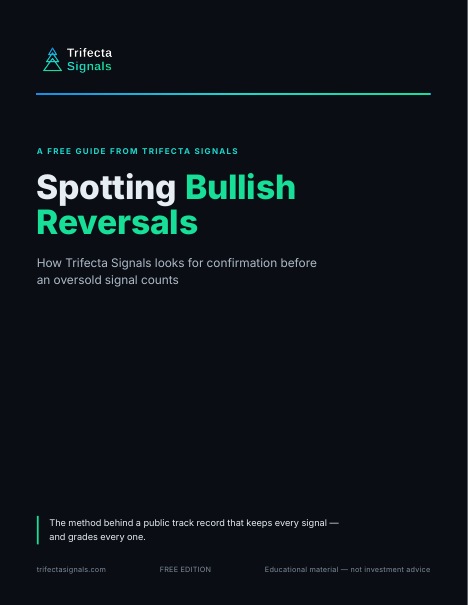
Spotting Bullish Reversals
The short guide to how Trifecta reads an oversold stock: the setup we look for, and why we wait for confirmation before an Early Signal counts. The same method behind the public track record.
Watching yields is step one. The guide is step two — how Trifecta turns a washed-out market into a short list of oversold setups worth watching.
Your guide is on its way to your inbox right away, with the download link inside the email. Signing up also adds you to the Trifecta Weekly Market Review, our Friday newsletter. No card. Along with the guide, you’ll get a short series of follow-up emails from us over the next week, plus the Weekly Market Review. Unsubscribe anytime.
Your guide is on its way
We just sent your guide to — the download link is inside the email, and you’re on the list for Friday’s Weekly Market Review. If you don’t see it within a few minutes, check your spam folder.
Haven’t received it? Add [email protected] and [email protected] to your contacts or safe senders list — that helps your inbox accept both the guide emails and the Friday newsletter.
Didn’t get it? Resend the guide email
Wrong address? Use a different email
You’re signed in, so there’s no email step — the guide is yours to download. Your Weekly Market Review opt-in lives on your dashboard, where you can change it anytime.
The yield curve today
Every maturity on November 16, 2026, the latest day published — with the same curve a month and a year earlier
Solid line: today. Fainter lines: a month ago and a year ago. The ringed points are the 2-year and 10-year yields the spread is measured from.
A normal curve slopes upward — the 10-year pays more than the 2-year (+0.29 on Nov 16, 2026) because lenders demand more for locking money away longer. When the 2-year climbs above the 10-year, the curve inverts — a flip that has shown up before every US recession of the past half-century, though sometimes well ahead of it.
The spread · 10-year minus 2-year, monthly since 1976
Above zero the curve is normal; below zero it is inverted. The spread has spent 99 of the last 605 months below zero — most recently in Aug 2024.
| Maturity | Nov 16, 2026 | A month ago | A year ago | Change, 1 year |
|---|---|---|---|---|
| 1M | 4.10% | 4.13% | 4.04% | +0.06 |
| 3M | 4.34% | 4.25% | 3.95% | +0.39 |
| 6M | 4.42% | 4.32% | 3.79% | +0.63 |
| 1Y | 4.62% | 4.47% | 3.66% | +0.96 |
| 2Y | 4.83% | 4.80% | 3.58% | +1.25 |
| 5Y | 4.93% | 5.02% | 3.72% | +1.21 |
| 10Y | 5.12% | 5.24% | 4.13% | +0.99 |
| 20Y | 5.51% | 5.65% | 4.69% | +0.82 |
Read left to right, this table is the yield curve. Today it rises steadily from the 1-month bill to the 20-year bond, and every maturity yields more than it did a year ago.
What is a Treasury yield?
When the US government borrows, it sells securities — Treasury bills, notes and bonds — and investors who buy them are lending it money. The yield is the annual return on that loan, stated as a percentage. Part of it is the interest the Treasury pays, called the coupon. The rest comes from the price: a bond bought for less than its face value earns the difference when the government repays the full amount at maturity, and one bought above face value gives some back.
That is why price and yield always move in opposite directions. If investors bid a bond's price up, the fixed coupon is spread over a bigger investment, so the yield falls. If they sell, prices drop and yields rise — a 'selloff in bonds' and a 'spike in yields' are the same event described from two sides. The yields on this page are par yields on constant-maturity securities from the Federal Reserve's H.15 release: the yield a newly issued Treasury of exactly that maturity would carry, estimated every business day from market prices.
The yield curve, explained
Plot the yields from shortest maturity to longest and you get the yield curve — a single picture of what it costs the government to borrow for three months versus twenty years. Its shape is one of the most watched signals in finance:
Normal (upward sloping). Long-term yields sit above short-term ones. Lenders tie money up for longer only if they are paid more, and the economy is expected to keep growing. This is the curve's usual shape, and the shape it has today: 4.34% at three months rising to 5.51% at twenty years.
Inverted. Short-term yields rise above long-term ones — it pays more to lend the government money for three months than for ten years. Inversions have preceded every US recession of the last fifty years, because they usually mean the Fed is holding short rates high enough to slow the economy while bond investors expect weaker growth ahead. The 10-year minus 3-month spread is the version researchers track: it turned negative in late 2022 and stayed at or below zero, on and off, into 2025 — the longest inversion on record. Today it is back to +0.78.
Flat. All maturities pay about the same — the in-between state, usually seen while the curve is passing from one shape to the other.
What is a yield curve inversion?
A yield curve inversion is when short-term Treasury yields rise above long-term ones — in the version the market quotes most, when the 2-year yield climbs above the 10-year yield. It reverses the normal order, in which lending the government money for longer pays more. The difference between the two rates is called the spread: positive on a normal curve, negative on an inverted one. On November 16, 2026 the 10-year yielded 5.12% and the 2-year 4.83%, a spread of +0.29 — a normal curve by this measure, which is what the chart at the top of this page shows.
Inversions happen when the Federal Reserve is holding short-term rates high to cool the economy while investors, expecting slower growth ahead, accept lower yields on long-term bonds. Short rates are pushed up from one end and long rates pulled down from the other until the curve flips.
The reason the flip gets so much attention is its track record: an inverted curve has preceded every US recession of the past half-century. Two cautions matter just as much. The lag is long and variable — the inversion that began in 2022 ran for well over a year before anything else happened — and the curve says nothing about how deep a downturn would be or exactly when it would start. Researchers often watch a second version, the 10-year minus 3-month spread, which tends to flip later. Think of an inversion as a warning light, not a clock.
Bills, notes and bonds
The three names are the same promise at different lengths. Bills run one year or less and pay no coupon: you buy at a discount and are repaid face value. Notes run 2 to 10 years and pay interest every six months. Bonds are the 20- and 30-year issues, also paying semiannual interest. The maturities charted here span the range the market trades most: bills at 1, 3 and 6 months, notes at 1, 2, 5 and 10 years, and the 20-year bond.
Two quirks in the history are worth knowing. The 1-month bill series starts only in 2001 — before that, the shortest bill the Fed published yields for was the 3-month. And the 20-year bond was not issued at all between 1987 and 1993, so its chart has a genuine gap there: the line breaks rather than inventing data. The 30-year bond exists too, but with its own long issuance gap (2002–2006); the 20-year gives the cleaner long-end record, which is why this page charts it.
How Treasury pricing works
New Treasuries are sold at auction, where large investors bid the yield they will accept — the auction effectively sets the coupon so the securities sell at about face value. After that they trade constantly in the secondary market, the deepest and most liquid bond market in the world, and it is those trading prices that produce the daily yields shown here. Because the securities are backed by the full faith and credit of the US government, their yields are treated as the risk-free rate: the floor under every other interest rate in the economy. A mortgage, a car loan or a corporate bond all price as the matching Treasury yield plus a spread for risk.
How yields affect stocks and mortgages
The 10-year yield is the economy's master rate. US fixed-rate mortgages are priced from it, so when it rose from 0.62% in Jul 2020 — its lowest monthly average on record — the housing market cooled within months. Corporate borrowing costs are set the same way. For the stock market the channel is the discount rate: a share is worth the present value of its future earnings, and higher yields shrink that present value today, with the longest-dated expectations (growth stocks) hit hardest. The opposite also holds — yields falling from the 15.32% monthly average peak of Sep 1981 powered one of the great bull markets in history. It cuts both ways, which is why this chart sits near the centre of every serious investor's screen.
How to read these charts
Choose a maturity with the buttons above the chart, a span with the range selector, and scrub any point for the exact yield on that date. Recent years are daily; earlier history is monthly averages, which is why older stretches look smoother. Shaded bands are US recessions. Two habits are worth forming: watch the spread tile at the top of this page, not just the levels — the curve's shape has historically said more about what comes next than any single yield; and remember that yields are not forecasts. They are prices, and like all prices they can be wrong.
Questions people ask
What is a Treasury yield?
A Treasury yield is the annual return an investor earns for holding a US government security to maturity, expressed as a percentage of the price paid. It combines the interest the Treasury pays (the coupon) with the difference between the purchase price and the face value repaid at maturity. When a Treasury’s market price rises, its yield falls, and vice versa — the two always move in opposite directions.
What is the current 10-year Treasury yield?
On November 16, 2026, the latest day published, the 10-year Treasury yield was 5.12%. The 3-month yield was 4.34%, so the 10-year paid +0.78 percentage points more than the 3-month. The chart at the top of this page is refreshed from Federal Reserve data, so it always shows the newest published figure.
What is a yield curve inversion?
The yield curve is the line you get by plotting Treasury yields from the shortest maturity to the longest. Normally it slopes upward — lenders demand more return for locking money away longer. A yield curve inversion is when short-term yields rise above long-term yields, which has preceded every US recession of the past half-century, though with long and variable lags. The market watches the 10-year minus 2-year spread most closely; researchers often use the 10-year minus 3-month version, which is the spread shown in the tile at the top of this page.
What is the difference between Treasury bills, notes and bonds?
Only the maturity. Bills are issued for one year or less (4, 8, 13, 17, 26 and 52 weeks) and pay no coupon — they are sold at a discount and repaid at face value. Notes run 2, 3, 5, 7 and 10 years and pay interest every six months. Bonds are the 20- and 30-year issues, also with semiannual coupons. All three are backed by the full faith and credit of the US government.
Why do Treasury yields matter for stocks and mortgages?
The 10-year yield is the benchmark that US mortgage rates and most corporate borrowing costs are priced from, so when it rises, monthly payments across the economy rise with it. For stocks, higher yields compete with equities for money and raise the rate at which future earnings are discounted, which tends to weigh most on growth shares. Falling yields do the reverse — which is why the stock market watches this chart as closely as any earnings report.
How often is this page updated?
Treasury yields are published every business day by the US Treasury and the Federal Reserve. This page refreshes weekly from the Federal Reserve’s H.15 release, via FRED, and the daily figures shown are the most recent the Fed has published at refresh time. Monthly averages carry the history back to 1962 for the longer maturities.
Data: Board of Governors of the Federal Reserve System, H.15 Selected Interest Rates (FRED series DGS1MO, DGS3MO, DGS6MO, DGS1, DGS2, DGS5, DGS10, DGS20), retrieved from FRED, Federal Reserve Bank of St. Louis. Daily figures are market yields on constant-maturity par securities; earlier history is monthly averages of the same series. Recession bands: National Bureau of Economic Research. This page is a data presentation, not investment advice.