

Sample Size and Statistical Significance for Investors
Why sample size, outliers, and overlapping signals matter when reading investing statistics, with simple worked examples of how much a percentage can really be trusted.
Last reviewed: November 2026.
A percentage on its own can be misleading. "70% of signals gained 10%" sounds firm, but its reliability depends on how many signals sit behind it, how they were spread over time, and whether a few extreme cases are doing the work. This guide is a companion to How to Read a Track Record, going one level deeper into the statistics.
How uncertain is a percentage?
Suppose a method's past hit rate is measured at 70%. If the true underlying rate were the same, a different set of cases would still give slightly different results just by chance. The standard error of a proportion gives a rough sense of the spread:
standard error = √( p × (1 − p) ÷ n )
where p is the observed rate and n is the number of independent cases. A rough 95% range is about two standard errors either side. Using 70%:
- 20 cases: an approximate 95% range of about 50% to 90%.
- 100 cases: an approximate 95% range of about 61% to 79%.
- 1,000 cases: an approximate 95% range of about 67% to 73%.
The same "70%" is a loose estimate at n=20 and a fairly tight one at n=1,000. (Simplified illustration; it assumes the cases are independent.)
Averages and outliers
Return averages are even more fragile than hit rates, because a single extreme result can dominate. Consider ten hypothetical signals: nine gain 10% each and one gains 1,000%.
- Average (mean) return: (9 × 10% + 1,000%) ÷ 10 = 109%
- Median return: 10%
The mean says the typical signal more than doubled. The median says the typical signal gained 10%. Neither is wrong, but they describe different things, and the gap between them signals that outliers are driving the average. When a record shows very large individual gains, look at the median, at the distribution, and at what the average would be without the top few results.
Independence: the hidden assumption
The standard-error math assumes each case is an independent event. Investing data often violates this:
- Clustering in time. Many signals can fire during the same market selloff, and then all recover (or all keep falling) together. Fifty signals from one week are not fifty independent tests; they may be closer to one test of one market environment.
- Repeat signals. The same company, or several share classes of it, can appear multiple times.
- Common factors. Stocks in one sector or style can move on the same news.
When cases cluster, the effective sample size is smaller than the raw count, and the real uncertainty is larger than the simple formula suggests. This is why a record covering many years and several market environments is more informative than one with a large count packed into a single stretch.
Statistical significance, plainly
A result is called "statistically significant" when it would be unlikely to arise by chance alone if there were no real effect. That is a narrow claim. It does not say the effect is large, that it will persist, or that it can be captured after costs. And when many patterns are tested, some will look significant purely by chance. This is the multiple-testing problem: try enough rules on past data and a few will appear to work.
Backtest versus live results
A backtest applies a rule to historical data after the fact. It can be honest and useful, but it carries risks that live, forward results do not: the rule may have been shaped while looking at the past, and data limits such as survivorship can flatter the outcome. A record that separates backtested history from results published in real time is easier to evaluate.
A checklist
- How many independent cases are behind this percentage?
- Does the record span different market conditions, or one stretch?
- What do the median and the worst cases look like, not just the mean?
- Would the result survive removing the top few winners?
- Is it backtested, live, or a mix, and is that clearly stated?
Key points
- Small samples give loose percentages. Check n before trusting a rate.
- Means can hide outliers. Compare them with medians.
- Clustered or repeated signals shrink the effective sample size.
- Significance is a narrow claim and does not guarantee future results.
Related: How to Read a Track Record · Drawdowns and Position Sizing · Glossary
Educational material only — not investment advice.
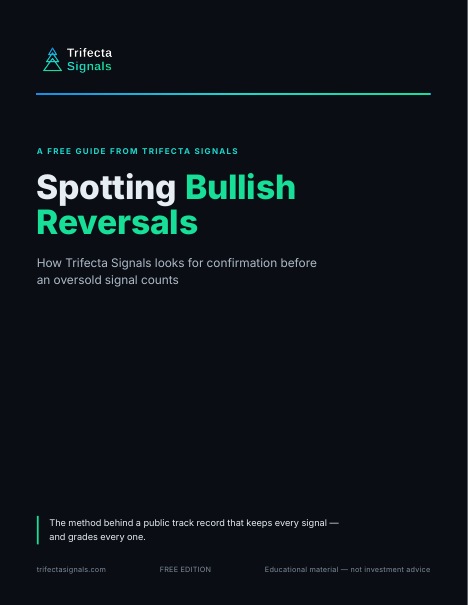
Spotting Bullish Reversals
The short guide to how Trifecta reads an oversold stock: the setup we look for, and why we wait for confirmation before an Early Signal counts. The same method behind the public track record.
Knowing how far a percentage can be trusted is step one. The guide is step two — how Trifecta turns a washed-out market into a short list of oversold setups worth watching.
Your guide is on its way to your inbox right away, with the download link inside the email. Signing up also adds you to the Trifecta Weekly Market Review, our Friday newsletter. No card. Along with the guide, you’ll get a short series of follow-up emails from us over the next week, plus the Weekly Market Review. Unsubscribe anytime.
Your guide is on its way
We just sent your guide to — the download link is inside the email, and you’re on the list for Friday’s Weekly Market Review. If you don’t see it within a few minutes, check your spam folder.
Haven’t received it? Add [email protected] and [email protected] to your contacts or safe senders list — that helps your inbox accept both the guide emails and the Friday newsletter.
Didn’t get it? Resend the guide email
Wrong address? Use a different email
You’re signed in, so there’s no email step — the guide is yours to download. Your Weekly Market Review opt-in lives on your dashboard, where you can change it anytime.
Win 30 days of trial access
Take the 5-question Technical Analysis Quiz — get all five right and win 30 days of trial access to the Trifecta Signals stock screener. No card, nothing to cancel. Have an access code instead? Create a free account and add it there — trial access starts the same way.
Five questions, hints included. You sign in only when you claim your trial access.