

Sectors and Industry Groups Explained
The 11 market sectors explained, and why a sector-wide selloff behaves differently from a single-company decline.
Last reviewed: November 2026.
Stocks do not move independently. Companies in the same industry face the same customers, costs, regulations, and economic conditions, so they often rise and fall together. Sectors are the standard way to group them.
The 11 sectors
The most widely used classification is the Global Industry Classification Standard (GICS), maintained by S&P Dow Jones Indices and MSCI. It divides the market into 11 sectors:
- Information Technology
- Health Care
- Financials
- Consumer Discretionary
- Communication Services
- Industrials
- Consumer Staples
- Energy
- Utilities
- Real Estate
- Materials
Below the sector: the GICS hierarchy
Each sector is divided further into industry groups, industries, and sub-industries — four levels in all. An industry group collects related industries inside a sector: within Financials, for example, banks, insurance companies, and capital-markets firms sit in separate industry groups, because their economics differ even though all three are "financial." Industries narrow the grouping again, and sub-industries describe a specific line of business.
The practical point is that similarity fades as you move up the hierarchy. Two companies in the same sub-industry usually share customers, inputs, and regulators, so news for one is often news for both. Two companies in the same sector but different industry groups may share little beyond the label, and a sector-level average can hide more than it reveals. When a headline says a sector rose or fell, the more useful question is usually which industry groups inside it did the moving.
Why sectors matter
Sector membership tells you which forces probably affect a company:
- Interest rates tend to matter a great deal for Financials, Real Estate, and Utilities.
- Commodity prices matter for Energy and Materials.
- Consumer spending matters for Consumer Discretionary and, differently, for Consumer Staples.
- Regulation and reimbursement matter for Health Care.
Sectors are sometimes called cyclical (more sensitive to the economic cycle, such as Consumer Discretionary or Industrials) or defensive (historically steadier, such as Consumer Staples or Utilities). These labels describe tendencies and can break down. "Defensive" describes steadier demand for what a business sells; it does not promise a steady share price — a defensive sector whose companies carry heavy debt can fall sharply when interest rates rise. And in a broad panic, correlations across sectors tend to rise, so distinctions that hold in normal times matter least on the worst days. "Cyclical" likewise describes sensitivity to the cycle, not a guarantee of falling first or recovering fastest. Treat both labels as shorthand, never as a property of the stock.
Sector-wide selloffs versus single-company declines
When a stock falls, a useful first question is: is it just this company, or the whole group?
- Typical cause: a sector-wide selloff usually traces to a rate change, regulation, commodity move, or shifting sentiment toward an industry; a company-specific decline usually traces to an earnings miss, a lost customer, legal trouble, or a management change.
- Peers: in a sector-wide selloff, peers fall together; in a company-specific decline, peers are mostly unaffected.
- What it can mean: in a sector-wide selloff, solid companies may be sold with weak ones — but the whole group can also keep falling. In a company-specific decline, the problem may be real and unique to the business.
Neither type guarantees a recovery. A sector can stay out of favor for years.
Concentration in indexes
Major indexes are not evenly spread across sectors, and sector weights shift over time. Most broad indexes are capitalization-weighted: each company's weight reflects its market value, so the largest companies — and whichever sectors they sit in — dominate the index's return. An index can even rise on a day when most of its member stocks fell, if the biggest ones rose. The weights are an outcome, not a plan: a sector's share grows simply because its prices rose, so concentration builds gradually through a long rally and can unwind quickly. An equal-weighted reading of the same index can tell a different story. Worth remembering when you read a market backdrop or heat map. See Reading the Index Heat Map.
Limits of classification
Classification is a judgment call. GICS assigns each company a single home based mainly on its principal business activity, judged largely from where its revenue and earnings come from. Large companies often span several businesses: a diversified company might run stores, a delivery network, and a computing-services arm, yet it receives one classification — and that one label drives its sector weight, peer comparisons, and place in sector statistics. The segment breakdowns in a company's own filings show the mix the single label hides. Classifications also change: a spin-off or a large acquisition can move a company to a different sector, and the system itself is revised from time to time (Communication Services, for instance, was created in 2018 by reorganizing existing sectors). Treat sector labels as a useful starting point, not a precise description.
Key points
- GICS groups the market into 11 sectors, which break into industry groups, industries, and sub-industries.
- The closer two companies sit in the hierarchy, the more their fortunes are likely to move together.
- Sector membership hints at which forces drive a company.
- Telling a sector selloff from a company-specific decline is a useful first question.
- Cap-weighted indexes let the largest sectors dominate, so an index move is not always the typical stock's move.
Related: Reading the Index Heat Map · Trend and Moving Averages · Glossary
Educational material only — not investment advice.
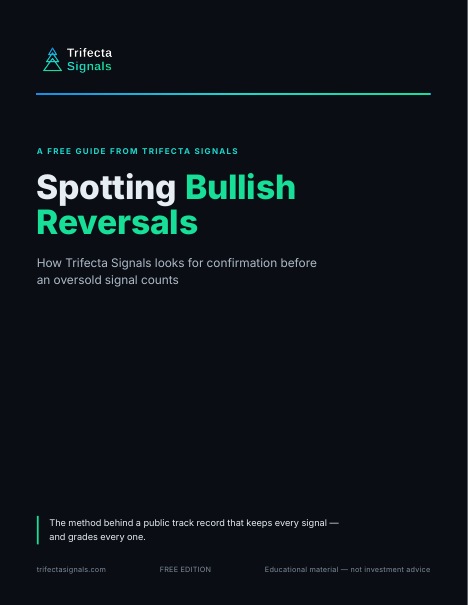
Spotting Bullish Reversals
The short guide to how Trifecta reads an oversold stock: the setup we look for, and why we wait for confirmation before an Early Signal counts. The same method behind the public track record.
Knowing which group a stock belongs to is step one. The guide is step two — how Trifecta turns a washed-out market into a short list of oversold setups worth watching.
Your guide is on its way to your inbox right away, with the download link inside the email. Signing up also adds you to the Trifecta Weekly Market Review, our Friday newsletter. No card. Along with the guide, you’ll get a short series of follow-up emails from us over the next week, plus the Weekly Market Review. Unsubscribe anytime.
Your guide is on its way
We just sent your guide to — the download link is inside the email, and you’re on the list for Friday’s Weekly Market Review. If you don’t see it within a few minutes, check your spam folder.
Haven’t received it? Add [email protected] and [email protected] to your contacts or safe senders list — that helps your inbox accept both the guide emails and the Friday newsletter.
Didn’t get it? Resend the guide email
Wrong address? Use a different email
You’re signed in, so there’s no email step — the guide is yours to download. Your Weekly Market Review opt-in lives on your dashboard, where you can change it anytime.
Win 30 days of trial access
Take the 5-question Technical Analysis Quiz — get all five right and win 30 days of trial access to the Trifecta Signals stock screener. No card, nothing to cancel. Have an access code instead? Create a free account and add it there — trial access starts the same way.
Five questions, hints included. You sign in only when you claim your trial access.