

Understanding Volatility and Beta
Volatility and beta explained in plain English: what they measure, how they are calculated, and what they miss about risk.
Last reviewed: November 2026.
"Volatility" and "beta" are two of the most quoted numbers in investing, and two of the most misunderstood. Both describe how a price has moved, not whether an investment is good or bad. This guide explains what each measures and where each falls short.
Volatility: how much a price swings
Volatility measures the size of a stock's typical price changes. The standard method takes the stock's daily percentage returns over some window (say, the past 60 trading days), computes their standard deviation, and often scales the result to an annual figure. A stock with 20% annualized volatility moves much less day to day than one with 60%.
Two features are worth remembering:
- It is symmetric. Volatility counts large up-moves and large down-moves alike: a fast rise raises measured volatility just as a fast fall does, even when holders benefited. But not every large gain means high volatility — a stock can climb steadily, day after day, and double over time with only modest day-to-day variation. Volatility is about variation along the path, not the size of the destination.
- It is backward-looking. It describes the window you measured. Volatility tends to cluster, so calm periods often follow calm periods and turbulent periods follow turbulent ones, but it can change abruptly.
How annualization works
Most quoted volatility figures are annualized, and the scaling is a convention rather than a forecast. The usual recipe multiplies the daily standard deviation by the square root of 252, roughly the number of trading days in a year: a daily standard deviation of 1% annualizes to about 16% (1% × √252 ≈ 15.9%). The convention exists so figures measured over different windows can be compared on one scale. It does not mean the price is expected to move by that amount over the next year.
Historical vs. implied volatility
The volatility described above is historical (sometimes called realized) volatility: it is measured from prices that have already occurred, and it says nothing directly about the future.
Implied volatility works in the opposite direction. It is backed out of option prices using an option-pricing model, so it reflects what buyers and sellers expect: roughly, the size of the move being priced in over the life of the option, in annualized terms. It is forward-looking, but not a prediction of direction — a high implied volatility means a large move is expected, up or down.
Index-level implied measures apply the same idea to a whole index; the best known gauges expected movement in a broad index over about the next 30 days. When such a gauge is elevated, the options market is paying up for protection against a large near-term move; when it is low, options are priced for calm. Implied running well above what the index has actually been doing suggests traders are bracing for something the recent past has not yet shown.
Volatility and compounding
Volatility also affects how returns add up over time. Percentage gains and losses do not cancel out: a 20% gain followed by a 20% loss averages zero, but the value ends at 96% of where it started (1.20 × 0.80 = 0.96) — a 4% compound loss. The wider the swings, the wider the gap between the simple average return and the compound growth actually earned, so of two investments with the same average return, the choppier one finishes behind. This "drag" is one reason large swings deserve respect even when they average out on paper.
Beta: sensitivity to the market
Beta measures how a stock has moved relative to a benchmark index, usually the S&P 500. It comes from regressing the stock's returns on the index's returns over a period, commonly several years of monthly returns or about one to two years of weekly returns.
- Beta of 1.0: has tended to move about as much as the market.
- Beta above 1.0 (e.g. 1.5): has tended to move more than the market, in both directions.
- Beta below 1.0 (e.g. 0.6): has tended to move less than the market.
- Beta near 0 or negative: has moved little with, or against, the market.
What these numbers miss
- Beta only captures market-related movement. A company can fall 40% on a fraud revelation, a lost customer, or a failed product while the market is flat. Beta, which tracks co-movement with the index, may barely register that kind of company-specific risk.
- A low beta is not low risk. A stock can have a low beta and still be volatile, or fall steadily for reasons unrelated to the market.
- Beta changes. It depends on the window and the benchmark. Different data providers report different betas for the same stock.
- Neither measures the experience of a loss. For that, look at drawdowns: the peak-to-trough decline. See Drawdowns and Position Sizing.
Volatility and oversold stocks
Stocks that have just fallen sharply usually show elevated volatility, because the price swings that produced the decline are inside the measurement window. That is one reason an oversold reading says little by itself. High volatility means outcomes are widely dispersed in both directions. It does not tilt the odds toward a rebound.
Key points
- Volatility measures the size of past price swings, up or down.
- Annualized figures scale daily variation by √252, a comparison convention, not a forecast.
- Implied volatility is backed out of option prices and looks forward; historical volatility is measured from past prices.
- Beta measures past sensitivity to a benchmark, not total risk.
- Both are backward-looking and depend on the measurement window.
- Drawdown figures complement both by showing how far a price actually fell.
Related: Drawdowns and Position Sizing · Popular Technical Indicators · Glossary
Educational material only — not investment advice.
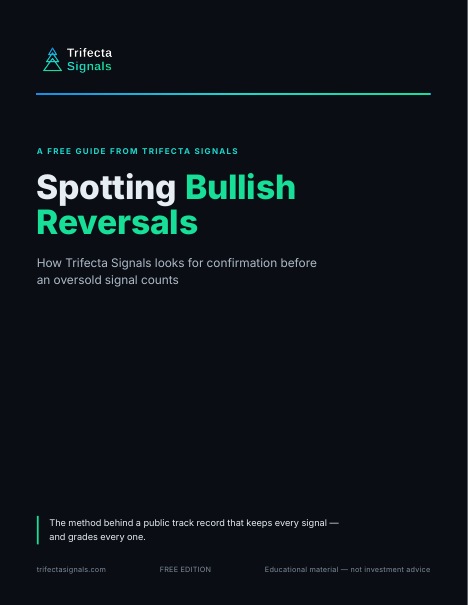
Spotting Bullish Reversals
The short guide to how Trifecta reads an oversold stock: the setup we look for, and why we wait for confirmation before an Early Signal counts. The same method behind the public track record.
Knowing what volatility and beta actually measure is step one. The guide is step two — how Trifecta turns a washed-out market into a short list of oversold setups worth watching.
Your guide is on its way to your inbox right away, with the download link inside the email. Signing up also adds you to the Trifecta Weekly Market Review, our Friday newsletter. No card. Along with the guide, you’ll get a short series of follow-up emails from us over the next week, plus the Weekly Market Review. Unsubscribe anytime.
Your guide is on its way
We just sent your guide to — the download link is inside the email, and you’re on the list for Friday’s Weekly Market Review. If you don’t see it within a few minutes, check your spam folder.
Haven’t received it? Add [email protected] and [email protected] to your contacts or safe senders list — that helps your inbox accept both the guide emails and the Friday newsletter.
Didn’t get it? Resend the guide email
Wrong address? Use a different email
You’re signed in, so there’s no email step — the guide is yours to download. Your Weekly Market Review opt-in lives on your dashboard, where you can change it anytime.
Win 30 days of trial access
Take the 5-question Technical Analysis Quiz — get all five right and win 30 days of trial access to the Trifecta Signals stock screener. No card, nothing to cancel. Have an access code instead? Create a free account and add it there — trial access starts the same way.
Five questions, hints included. You sign in only when you claim your trial access.