

Moving Average Crossovers: Golden Cross and Death Cross
What golden crosses and death crosses are, how they are calculated, and why moving-average crossovers are lagging signals with mixed results.
Last reviewed: November 2026.
Few chart patterns get as much attention as the "golden cross" and the "death cross." Their names sound decisive. The reality is more modest, and more interesting.
Definitions
- Golden cross: the 50-day moving average crosses above the 200-day moving average.
- Death cross: the 50-day moving average crosses below the 200-day moving average.
A moving average smooths past prices into a single line. The 50-day average reacts relatively quickly; the 200-day reacts slowly. When the two lines cross, it is the shorter average itself that has moved from below the longer average to above it (golden) or from above it to below (death) — a statement about the two averages, and only indirectly about the price, which crossed both lines earlier. For the basics, see Trend and Moving Averages.
Calculated on closing, adjusted prices
Crossovers are computed from closing prices, and the averages only take their final values at the close. An apparent cross in the middle of a session is provisional: the averages are not settled until the day ends, and a cross is properly dated to the close that produced it.
The price series matters too. For the averages to mean anything across corporate actions, they should be built on split- and dividend-adjusted closing prices, so a split or a large dividend does not bend the lines and manufacture a cross that no trend produced. See Stock Splits, Reverse Splits, and Adjusted Prices.
They are lagging by construction
Both averages are built from past prices, and the 200-day is built from a long window. By the time a crossover occurs, the price has usually already moved a long way. A death cross typically appears after a decline is well underway; a golden cross typically appears after a recovery has already begun. In other words, the crossover is confirming something that has largely happened, not forecasting what comes next.
What studies and experience suggest
Researchers and analysts have looked at index and stock performance after these crossovers, and results have been mixed. Several themes recur:
- Results depend on the period and the market tested. A pattern that looked useful in one era can look weak in another.
- False signals (whipsaws) are common. In choppy, sideways markets, the averages can cross back and forth, producing a series of signals that go nowhere.
- Some declines have continued after a death cross, and others have reversed soon after. Both outcomes appear in market history.
- Few independent events. Major index crossovers occur only occasionally, so any statistic built on them rests on a small sample. See Sample Size and Statistical Significance.
Because results vary, it is better to view a cross as a description of the current trend state than as a prediction.
Why the pattern draws attention anyway
Many market participants watch the same lines, and widely watched levels can influence behavior. Headlines about a "death cross" can also shape sentiment. That attention does not make the pattern reliable, but it explains why it gets discussed.
Reading a crossover sensibly
- Check the direction of the 200-day average itself: is it rising, flat, or falling?
- Check the distance between price and the averages. A crossover after a very large move says something different from one in a quiet market.
- Consider the market context: is the whole index in the same state, or only this stock?
- Remember that the choice of 50 and 200 is a convention. Other pairs (20/100, for instance) behave similarly and also lag.
Key points
- A golden or death cross is a 50-day/200-day average crossover.
- Both lag the price and often confirm moves already made.
- Historical results are mixed and rest on few independent events.
Related: Trend and Moving Averages · The 200-Day and 200-Week Averages · Glossary
Educational material only — not investment advice.
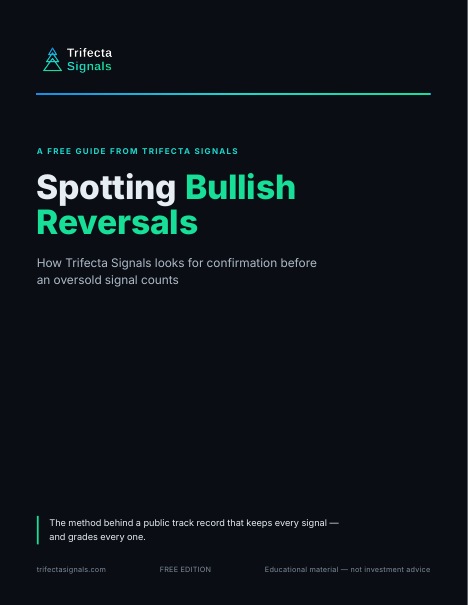
Spotting Bullish Reversals
The short guide to how Trifecta reads an oversold stock: the setup we look for, and why we wait for confirmation before an Early Signal counts. The same method behind the public track record.
Knowing what a crossover can and cannot say is step one. The guide is step two — how Trifecta turns a washed-out market into a short list of oversold setups worth watching.
Your guide is on its way to your inbox right away, with the download link inside the email. Signing up also adds you to the Trifecta Weekly Market Review, our Friday newsletter. No card. Along with the guide, you’ll get a short series of follow-up emails from us over the next week, plus the Weekly Market Review. Unsubscribe anytime.
Your guide is on its way
We just sent your guide to — the download link is inside the email, and you’re on the list for Friday’s Weekly Market Review. If you don’t see it within a few minutes, check your spam folder.
Haven’t received it? Add [email protected] and [email protected] to your contacts or safe senders list — that helps your inbox accept both the guide emails and the Friday newsletter.
Didn’t get it? Resend the guide email
Wrong address? Use a different email
You’re signed in, so there’s no email step — the guide is yours to download. Your Weekly Market Review opt-in lives on your dashboard, where you can change it anytime.
Win 30 days of trial access
Take the 5-question Technical Analysis Quiz — get all five right and win 30 days of trial access to the Trifecta Signals stock screener. No card, nothing to cancel. Have an access code instead? Create a free account and add it there — trial access starts the same way.
Five questions, hints included. You sign in only when you claim your trial access.